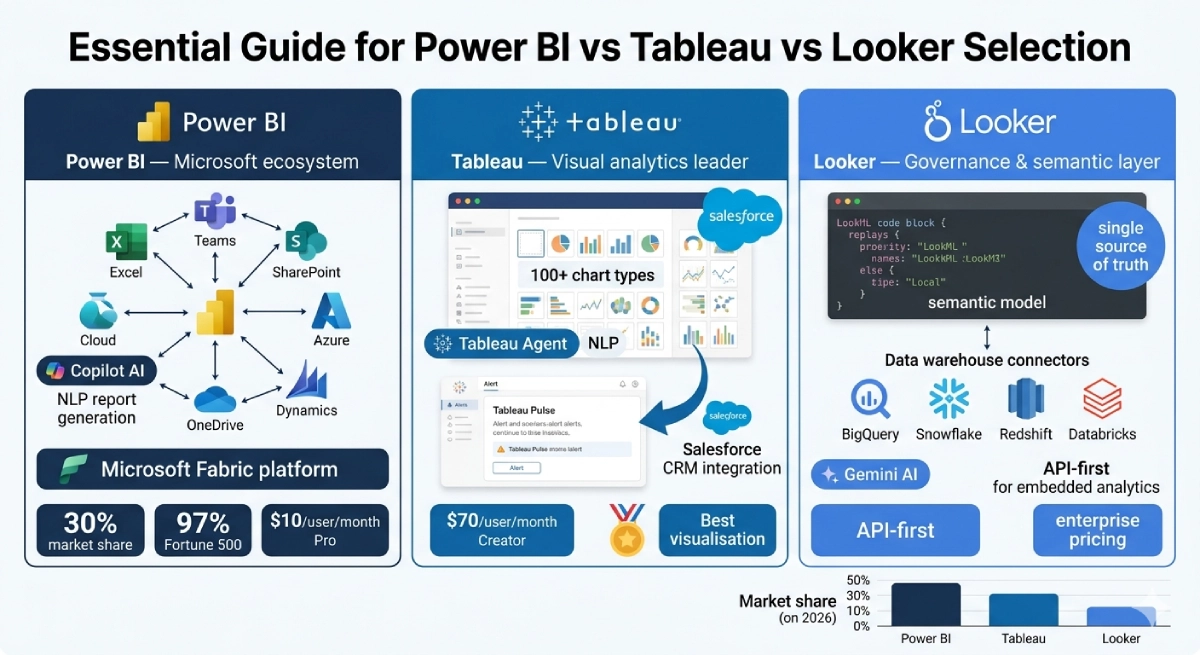
Power BI vs Tableau vs Looker is the business intelligence comparison that every data analyst, IT director, and analytics team leader faces in 2026 — because these three platforms collectively define the enterprise BI market, and choosing the wrong one costs organisations tens of thousands of dollars annually in wasted licensing, failed adoption, or analytical capability gaps. The market reality is unambiguous: Microsoft Power BI holds approximately 30% of the global BI market, with 97% of Fortune 500 companies relying on it and a Gartner Magic Quadrant Leader position for 18 consecutive years.
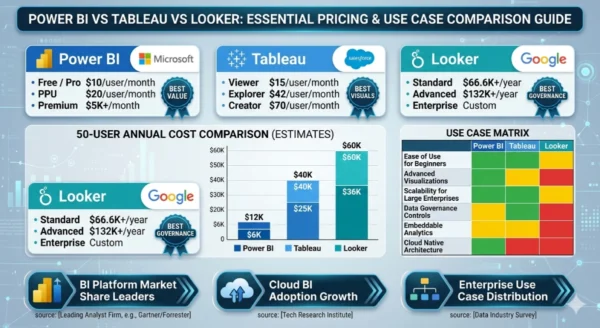
Tableau (owned by Salesforce) holds approximately 17.75% of the analytics market and has maintained its Gartner Leader position for 12 consecutive years, with widely recognised superiority in visual analytics and data storytelling. Looker (owned by Google Cloud) commands a premium position in enterprise data governance through its LookML semantic modelling layer, earning a 4.5/5 rating from 908 verified Gartner reviews. In 2026, all three platforms have added significant AI capabilities — Power BI Copilot, Tableau Agent, and Gemini-powered Looker analytics — reshaping what self-service BI means. But the pricing gap between them is striking: a 50-user team pays $6,000–$12,000 annually for Power BI, $25,000–$40,000 for Tableau, and $36,000–$60,000 for Looker. Understanding what justifies those differences, and which platform serves which organisation, is exactly what this Power BI vs Tableau vs Looker comparison delivers.
Power BI vs Tableau vs Looker: The 2026 BI Market Landscape
The Power BI vs Tableau vs Looker comparison sits at the centre of a $50 billion+ business intelligence market that is undergoing the most significant transformation since dashboards replaced spreadsheets. The shift in 2026 is threefold: AI-generated insights are becoming native to all major platforms, cloud-native data warehouses (Snowflake, BigQuery, Databricks) have become the preferred data layer displacing on-premises data warehouses, and the definition of “business user” has expanded to include executives and operational staff who expect to query data in natural language rather than navigate pre-built dashboards.
Together, Tableau and Power BI account for approximately 40% of BI platform usage in organisations worldwide — a duopoly that has solidified even as new entrants and open-source alternatives compete for market share. Looker occupies a different position: not the most widely deployed by seat count, but arguably the most strategically important platform for data engineering teams that need a governed semantic layer across the enterprise.

Power BI vs Tableau vs Looker: Microsoft Power BI Explained
Definition
Microsoft Power BI is a cloud-based business intelligence and analytics platform launched in 2015 that has become the world’s most widely adopted BI tool by market share. Built as part of Microsoft’s Power Platform alongside Power Apps, Power Automate, and Power Pages, Power BI benefits from deep integration with the Microsoft 365 ecosystem — Excel, Teams, SharePoint, Azure, Dynamics 365, and OneDrive — that most enterprise organisations already use as their primary productivity stack. Power BI consists of three main components: Power BI Desktop (a free Windows application for building reports), Power BI Service (the cloud-based sharing and collaboration platform), and Power BI Mobile (native iOS and Android apps).
Its core data modelling language, DAX (Data Analysis Expressions), is Excel-familiar enough for analysts with spreadsheet backgrounds to adopt quickly. In the Power BI vs Tableau vs Looker comparison, Power BI’s defining characteristics are its unbeatable price-to-capability ratio, its Microsoft ecosystem integration depth, and its AI Copilot features that in 2026 allow users to generate reports and write DAX queries in natural language. The platform saves an estimated 125 hours per user annually through self-service reporting, and 58% of organisations report it pays for itself within one year.
Strengths and Advantages
- Unbeatable price-to-capability ratio: Pro at $10/user/month delivers comprehensive BI capability — the lowest total cost of ownership of any enterprise BI platform. Delivers approximately 80% of enterprise BI at 20% of Tableau’s price
- Microsoft 365 ecosystem integration: Native, seamless integration with Excel, Teams, SharePoint, Azure, Dynamics, and OneDrive — the stack that most enterprise organisations already run. Reports embed directly in Teams channels and SharePoint pages without additional configuration
- Excel user adoption: Power BI’s interface and DAX formula language are close enough to Excel that analysts with spreadsheet skills can become productive in days, not weeks — significantly reducing training costs and time-to-value compared to Tableau or Looker
- Microsoft Fabric integration: Microsoft Fabric — launched in 2023 and maturing in 2026 — integrates Power BI with Azure Synapse Analytics and Azure Data Factory, creating a unified analytics platform that eliminates 10,000+ hours of manual data engineering work for large organisations
- Dominant adoption: 97% Fortune 500 adoption and 30% global BI market share means Power BI skills are the most in-demand BI competency in the job market — largest talent pool and learning resource ecosystem
- AI Copilot: Power BI Copilot generates complete reports from plain English descriptions, writes DAX queries from natural language, and creates narrative summaries — the most Microsoft-integrated AI analytics experience in the market
Limitations and Constraints
- AI features require premium tiers: Power BI Copilot requires Microsoft Fabric F64 capacity or Power BI Premium P1 capacity — the features most marketed require significant additional investment above the $10/month Pro licence
- Windows-centric development: Power BI Desktop, the primary report-building tool, runs only on Windows — Mac users must use the web interface (Power BI Service) which offers fewer features, creating a suboptimal experience for non-Windows development environments
- Visualisation limitations: Power BI’s built-in chart types and design flexibility are more limited than Tableau — complex custom visualisations require importing third-party visuals from the AppSource marketplace, adding governance considerations
- Microsoft ecosystem dependency: Power BI’s greatest strength is also a risk — organisations that move away from Azure or Microsoft 365 face significant migration pain. Non-Azure data source connections often require additional configuration compared to Tableau’s broader native connectors
- DAX complexity ceiling: DAX (Data Analysis Expressions), Power BI’s calculation language, is powerful but has a steep complexity ceiling — advanced analytical calculations require specialist expertise that is harder to develop than Tableau’s calculated fields
- Governance challenges: With broad self-service creation comes governance complexity — organisations frequently struggle with dashboard proliferation and inconsistent metrics without a semantic layer like Looker’s LookML
Power BI Key Technical Parameters (2026):
Pricing: Free → Pro $10/user/month → Premium Per User $20/user/month → Premium Per Capacity from $5,000/month. Market Share: ~30% global BI; 22.45% analytics platform market; 97% Fortune 500. AI: Power BI Copilot (natural language reports, DAX generation) — requires Fabric F64 or Premium P1. Furthermore, Data Sources: 100+ native connectors; Excel, SQL Server, Azure deep integration; REST APIs. Key Language: DAX (Data Analysis Expressions) for calculations; Power Query (M language) for data transformation. Additionally, Deployment: Cloud (Power BI Service) + Desktop app (Windows only) + Mobile (iOS/Android). Moreover, Gartner: Magic Quadrant Leader for 18 consecutive years; highest in Ability to Execute seventh consecutive year (2025).
Power BI vs Tableau vs Looker: Tableau Explained
Definition
Tableau is a visual analytics platform founded in 2003 and acquired by Salesforce in 2019 for $15.7 billion — a transaction that positioned Tableau as the analytics layer for the world’s largest CRM platform and the broader Salesforce Customer 360 ecosystem. Tableau’s defining characteristic across the Power BI vs Tableau vs Looker comparison is its unmatched data visualisation capability: more than 100 chart types, a drag-and-drop canvas that allows analysts to build complex, interactive dashboards without writing code, and a design flexibility that no other enterprise BI tool matches for visual storytelling and executive presentation quality.
In 2026, Tableau has expanded its AI capabilities significantly: Tableau Agent (formerly Einstein Copilot) enables natural language queries and automated data preparation, while Tableau Pulse delivers proactive alerts about metric changes to users who do not regularly open dashboards. The platform connects to 100+ data sources and offers both cloud-hosted (Tableau Cloud) and self-managed (Tableau Server) deployment options. Salesforce’s integration of Tableau into the Einstein 1 Platform enabled 16% growth — significantly higher than most BI vendors — and gives Tableau customers native access to CRM analytics that Power BI and Looker cannot replicate. Tableau remains the aspirational BI tool: organisations that invest in it typically have dedicated BI professionals who extract significantly more value from its visualisation depth than casual users would.
Strengths and Advantages
- Industry-leading visualisation: More than 100 chart types, unparalleled design flexibility, and visual storytelling capabilities that no other enterprise BI platform matches — the gold standard for executive presentations, client reports, and public-facing analytics
- Drag-and-drop analytics depth: Calculated fields, parameters, table calculations, and dashboard actions enable analysts to build sophisticated analytical workflows without writing SQL or Python — rewarding deep expertise with exceptional analytical capability
- Salesforce ecosystem integration: Native Tableau + Salesforce CRM integration creates a unified view of sales, marketing, and service data that Power BI and Looker cannot replicate with the same depth — critical for Salesforce-centric organisations
- Broad data connectivity: 100+ native connectors spanning cloud data warehouses, databases, flat files, and web data connectors — more flexible than Power BI for organisations with diverse, non-Microsoft data sources
- Strong community and talent pool: Tableau has cultivated one of the largest and most active BI communities globally — Tableau Public, Tableau User Groups, and the Tableau Certification programme create a rich talent ecosystem and extensive learning resources
- Tableau Pulse proactive insights: Rather than requiring users to open dashboards, Tableau Pulse sends proactive alerts about significant metric changes — shifting BI from pull (users find insights) to push (insights find users) for executive and operational users
Limitations and Constraints
- Significant cost premium: Creator licences at $70/user/month are 7× more expensive than Power BI Pro — a 50-user team with mixed roles pays $25,000–$40,000 annually vs $6,000–$12,000 for Power BI, a difference that requires strong business justification
- AI features gated behind premium tiers: Tableau Agent requires a Tableau+ subscription on top of existing licensing — the most compelling AI features are not available at standard pricing, adding significant additional cost for organisations that want them
- Complex licensing model: The three-tier Creator/Explorer/Viewer model requires careful licence management — users often need upgrades from Viewer to Explorer when they want to make minor edits, creating frequent licensing requests and cost overruns
- Limited governance for self-service: Like Power BI, Tableau’s strength in self-service creation creates governance challenges — metrics and definitions can diverge across dashboards without a central semantic layer, leading to “which number is right?” debates
- Salesforce integration complexity outside Salesforce: Organisations that are not Salesforce customers often find Tableau’s Salesforce integration features irrelevant, and licensing complexities around the Einstein 1 Platform can create confusion for non-Salesforce buyers
- Performance on large datasets: Tableau can experience performance degradation on very large datasets without careful data extract management — in-memory extracts (.hyper files) must be managed carefully for production-scale deployments
Tableau Key Technical Parameters (2026):
Pricing: Viewer $15 → Explorer $42 → Creator $70/user/month (all annual billing). Market Share: ~17.75% analytics market; Gartner Leader 12 consecutive years. AI: Tableau Agent (natural language queries, automated prep — requires Tableau+); Tableau Pulse (proactive metric alerts). Furthermore, Data Sources: 100+ native connectors; broad cloud warehouse, database, and flat file support. Visualisation: 100+ chart types; drag-and-drop canvas; calculated fields and parameters. Additionally, Deployment: Tableau Cloud (SaaS) + Tableau Server (self-managed) + Tableau Desktop. Moreover, Ownership: Salesforce (acquired 2019, $15.7 billion); integrated into Einstein 1 Platform; 16% growth rate post-integration.
Power BI vs Tableau vs Looker: Looker Explained
Definition
Looker is a cloud-native business intelligence and data platform acquired by Google Cloud in 2019 for $2.6 billion. Unlike Power BI and Tableau — which are primarily visualisation-and-reporting tools — Looker is fundamentally a semantic modelling and data governance platform that happens to include visualisation. The key to understanding Looker in the Power BI vs Tableau vs Looker comparison is its LookML modelling language: a code-based layer that sits between your data warehouse and your analytics users, defining all business logic, metric calculations, and data relationships in a single, version-controlled, auditable place.
When an organisation uses LookML to define “revenue,” every user across every team — whether they access data through Looker’s interface, export to a spreadsheet, or query via Looker’s API — gets the exact same number. This “single source of truth” governance capability is Looker’s primary value proposition and the reason it commands enterprise pricing that dwarfs Power BI and Tableau. Looker does not require a desktop client — it is entirely web-based and cloud-native. Its API-first architecture makes it the preferred choice for organisations building embedded analytics into their own products. In 2026, Looker integrates Gemini-powered AI analytics and benefits from its deep connection to Google Cloud services including BigQuery, Vertex AI, and Google Analytics. Note: Looker Studio (formerly Google Data Studio) is a separate, free product from Google — this comparison covers Looker (the enterprise platform), not Looker Studio.
Strengths and Advantages
- LookML semantic layer — single source of truth: All business logic, metric definitions, and data relationships defined once in version-controlled code — “revenue” means the same thing in every report, dashboard, export, and API call across the organisation. This eliminates the most common enterprise analytics failure: metric disagreement
- Best-in-class data governance: Row-level security, field-level permissions, complete audit trails, and fine-grained access controls give Looker the most comprehensive governance framework of the three platforms — essential for regulated industries (finance, healthcare, legal)
- Embedded analytics leadership: Looker’s API-first architecture enables full embedding of analytics into custom applications and SaaS products — technology companies building analytics into their own products choose Looker more than any other BI platform
- Cloud data warehouse optimisation: Looker pushes query computation to the warehouse (BigQuery, Snowflake, Redshift, Databricks) rather than extracting data — always queries live data, generates optimised SQL, and scales with the warehouse without data movement
- Google Cloud ecosystem integration: Deep integration with BigQuery, Vertex AI, Google Analytics, and Google Cloud services — the preferred BI layer for organisations using Google Cloud as their primary data platform
- 85% faster reporting cycles: TrustRadius data shows Looker customers report 85% faster reporting cycles after implementation — the LookML governance layer eliminates the data engineering bottleneck that slows report creation in Power BI and Tableau deployments
Limitations and Constraints
- LookML learning curve: Business analysts and non-technical users cannot create content in Looker without support from a data team that knows LookML — all reporting must conform to the LookML model, requiring specialist engineering expertise to maintain and extend
- Highest total cost: Standard pricing starts at approximately $66,600/year for 10 users — significantly more expensive than Power BI and Tableau at equivalent scale; add-on viewers at $400/year and LookML developers at $1,665/year make enterprise deployments costly
- Limited visualisation flexibility: While Looker’s visualisations are functional and clean, they lack the design flexibility and chart-type depth of Tableau — organisations that need beautiful executive visualisations or complex custom charts find Looker’s visualisation layer restrictive
- No offline/desktop mode: Looker is entirely web-based — there is no desktop application for offline report building or data exploration without internet connectivity
- Google Cloud preference: While Looker connects to multiple data warehouses, its deepest integration and best performance are with BigQuery — organisations not using Google Cloud services miss out on the most optimised Looker experience
- Self-service limitations: The strict governance that makes LookML valuable also limits flexibility — power users wanting ad-hoc exploration outside the defined LookML model are frustrated by constraints that Tableau and Power BI do not impose
Looker Key Technical Parameters (2026):
Pricing: Standard ~$66,600/year (10 users); Advanced ~$132,000/year; Enterprise custom; add-on viewers $400/user/year, developers $1,665/user/year. Gartner: Leader quadrant; 4.5/5 rating from 908 verified reviews. AI: Gemini-powered analytics; integrated with Vertex AI for advanced ML capabilities. Furthermore, Key Differentiator: LookML semantic modelling layer — single source of truth, version-controlled, auditable business logic. Architecture: Cloud-native, web-only (no desktop); API-first for embedded analytics; pushes computation to warehouse (no data extraction). Additionally, Deployment: Cloud only (hosted on Google Cloud); connects to BigQuery, Snowflake, Redshift, Databricks, and other warehouses. Moreover, Ownership: Google Cloud (acquired 2019, $2.6 billion); integrated with Google Cloud AI and data services.
Power BI vs Tableau vs Looker: AI Features in 2026
All three platforms launched significant AI capabilities in 2025–2026, fundamentally changing the Power BI vs Tableau vs Looker comparison. The AI race in BI is about enabling non-technical users to ask questions in natural language and receive accurate, governed answers — replacing the “submit a ticket, wait for an analyst” workflow that has defined enterprise BI since dashboards were invented.
Power BI Copilot
Availability: Requires Microsoft Fabric F64 capacity or Power BI Premium P1 capacity — premium tiers only
Core capabilities in 2026:
- Generate complete reports from plain English descriptions — describe the analysis you want, Copilot builds the visuals
- Write DAX queries from natural language — “show me year-over-year revenue by region” produces working DAX code
- Create narrative summaries of dashboard data for reports and presentations
- Suggest report improvements and visualisation choices
- Q&A visual enables natural language data queries for end users directly in published reports
Tableau Agent
Availability: Requires Tableau+ subscription on top of standard licensing — additional cost above Creator/Explorer/Viewer pricing
Core capabilities in 2026:
- Tableau Agent (formerly Einstein Copilot): natural language queries, automated data preparation, and dashboard narrative generation
- Tableau Pulse: proactive metric alerts — instead of users opening dashboards, Pulse sends digest notifications about significant changes in key metrics
- Einstein Discovery integration: predictive insights and what-if analysis powered by Salesforce AI
- Automated insight suggestions: surfaces patterns and anomalies in data that users might not have thought to look for
Looker + Gemini
Availability: Integrated into Looker’s platform via Google Cloud; specifics depend on licensing tier
Core capabilities in 2026:
- Gemini-powered natural language queries — ask questions in English, get answers from governed LookML data models
- Integrated with Vertex AI for building and deploying ML models directly on warehouse data accessed through Looker’s semantic layer
- AI-powered data exploration that respects LookML governance — natural language queries remain constrained by the semantic model, preventing governance violations
- Looker Conversational Analytics: embedded AI for customers building analytics products
12 Critical Differences: Power BI vs Tableau vs Looker
The Power BI vs Tableau vs Looker comparison below covers every key dimension — from pricing and adoption to visualisation, governance, AI features, and ecosystem fit — giving you the complete picture for BI platform selection in 2026.
Aspect | Power BI | Tableau | Looker |
|---|---|---|---|
| Core Philosophy | Accessible BI for the entire Microsoft organisation — democratise data with familiar tools | Visual analytics depth — empower analysts to explore and communicate data through superior visualisation | Governed semantic layer — one source of truth for the entire enterprise, accessed through any interface |
| Entry Pricing | Free (limited); Pro $10/user/month — lowest entry cost of the three platforms | Viewer $15/month; Explorer $42/month; Creator $70/month — significantly higher than Power BI | Custom enterprise pricing; Standard ~$66,600/year for 10 users; no transparent per-user pricing |
| 50-User Annual Cost | $6,000–$12,000 (Pro to PPU mix) | $25,000–$40,000 (Creator/Explorer/Viewer mix) | $36,000–$60,000 (Standard to Advanced) |
| Ease of Use | High — Excel-familiar interface; drag-and-drop; DAX accessible to spreadsheet users | High for analysts — drag-and-drop canvas rewards expertise; less accessible for non-technical business users | Low for business users — LookML requires data engineering expertise; high for governed data consumers |
| Visualisation Quality | Good — wide range of built-in visuals; third-party custom visuals via AppSource | Excellent — 100+ chart types, unparalleled design flexibility, industry-leading visual storytelling | Adequate — functional and clean; lacks the flexibility and design depth of Tableau |
| Data Governance | Moderate — sensitivity labels, row-level security; governance requires discipline without a semantic layer | Moderate — similar to Power BI; certification features help but no enforced semantic model | Excellent — LookML semantic layer enforces single source of truth; version-controlled, auditable, fine-grained access control |
| Ecosystem Integration | Microsoft 365, Azure, Teams, SharePoint, Dynamics, Excel — the deepest Microsoft stack integration | Salesforce CRM, Salesforce Cloud — exceptional for Salesforce customers; broad connector library for others | Google Cloud (BigQuery, Vertex AI, Google Analytics) — excellent; multi-warehouse via Looker API |
| AI Features | Copilot: report generation, DAX writing, narrative summaries — requires Fabric/Premium capacity | Tableau Agent: NLP queries, auto prep; Tableau Pulse: proactive alerts — requires Tableau+ premium tier | Gemini AI: governance-native NLP; Vertex AI ML integration; AI constrained by LookML model |
| Embedded Analytics | Power BI Embedded available; API support; primarily designed for internal use | Tableau Embedded Analytics — embedding in third-party apps supported; developer-focused features | API-first — best embedded analytics of the three; preferred by SaaS companies building analytics into products |
| Market Share | ~30% global BI; 22.45% analytics market; 97% Fortune 500 — largest footprint | ~17.75% analytics market — second largest; Gartner Leader 12 years | Niche enterprise — premium segment; highest satisfaction scores per seat; smaller total user base |
| Gartner Position | Leader 18 consecutive years; highest in Completeness of Vision and Ability to Execute (2025) | Leader 12 consecutive years; strong in data prep and visual analytics; 4.4/5 from 3,979 reviews | Leader (joined Leaders quadrant 2024); 4.5/5 from 908 reviews; strong governance and composability |
| Best For | Microsoft 365 organisations, Excel users, cost-sensitive teams, broad enterprise BI adoption | Visual analytics teams, Salesforce customers, organisations with dedicated BI professionals | Data engineering teams, Google Cloud orgs, companies needing governed metrics, SaaS embedded analytics |
Power BI vs Tableau vs Looker: Use Cases and Team Profile Match
Power BI — Ideal Scenarios
- Microsoft 365 enterprise: Organisations already paying for Office 365 or Microsoft 365 get Power BI Pro included in E3 and E5 plans — the effective marginal cost is zero, making Power BI the immediate default choice
- Excel-heavy analytics culture: Teams whose analysts live in Excel find Power BI’s learning curve the lowest — DAX is Excel-familiar, Power Query mirrors Excel Power Query, and report embedding in SharePoint/Teams requires zero additional infrastructure
- Cost-sensitive BI deployment: Organisations that need broad BI access across hundreds of users with limited analytics budget — Power BI Pro at $10/month is the only viable enterprise BI option at that price point
- Azure data platform users: Organisations with Azure Synapse, Azure Data Factory, or Azure SQL as their primary data infrastructure get native, zero-configuration connectivity to Power BI — the tightest data platform integration of the three
- Mixed-skill user bases: Organisations where both technical analysts and non-technical business users need BI access — Power BI’s broad spectrum from simple drag-and-drop to advanced DAX accommodates both groups on one platform
Tableau — Ideal Scenarios
- Executive and client-facing dashboards: Board presentations, investor reports, client-facing analytics portals, and public data visualisations where design quality and visual impact justify the premium cost
- Salesforce CRM analytics: Organisations with Salesforce as their primary CRM get native Tableau integration through the Einstein 1 Platform — sales pipeline analysis, customer journey dashboards, and revenue analytics that leverage CRM data directly
- Dedicated BI and analytics teams: Companies with professional data analysts who build and maintain sophisticated analytical products — Tableau rewards deep expertise in calculated fields, parameters, and dashboard actions with capabilities no other platform matches
- Complex data exploration: Research-intensive teams (data science, financial analysis, strategic planning) that need to explore hypotheses through flexible visual analysis rather than navigating pre-built reports
- Healthcare and life sciences visualisation: Industries where data visualisation informs clinical or regulatory decisions and visual clarity is critical — Tableau’s chart quality and annotation capabilities are preferred for these high-stakes presentations
Looker — Ideal Scenarios
- Metric governance at scale: Organisations where “what is our revenue?” generates multiple conflicting answers from different teams — LookML eliminates this by defining all metrics once, in code, with version control and audit trails
- SaaS embedded analytics: Technology companies building analytics into their own products for customers — Looker’s API-first architecture, multi-tenancy, and embedded SDK make it the preferred choice for productised analytics
- Google Cloud data platform: Organisations with BigQuery as their primary data warehouse get the tightest Looker integration — Looker generates optimised BigQuery SQL, integrates with Vertex AI, and connects natively to Google Analytics and Google Cloud services
- Regulated industries requiring audit trails: Financial services, healthcare, and legal organisations where every data access and metric calculation must be auditable — Looker’s governance framework provides the required compliance infrastructure
- E-commerce and product analytics: Companies where consistent DAU, MAU, conversion, and revenue metric definitions across engineering, marketing, and finance teams are business-critical — LookML’s semantic layer solves this structurally
Power BI vs Tableau vs Looker: Industry Application Matrix
| Industry | Power BI Fit | Tableau Fit | Looker Fit |
|---|---|---|---|
| Financial Services | High — Azure integration, Excel familiarity, broad reporting | High — complex risk visualisations, regulatory reporting, executive dashboards | High — audit trails, metric governance, compliance reporting |
| Healthcare / Life Sciences | High — Microsoft Teams integration, clinical reporting | Excellent — clinical data visualisation, outcomes analysis, regulatory submissions | High — HIPAA-aligned access controls, patient data governance |
| E-Commerce / Retail | High — sales dashboards, inventory tracking, CRM reporting | High — product analytics, customer journey mapping | Excellent — consistent DAU/MAU/conversion metrics, funnel governance |
| Technology / SaaS | Medium — strong for internal ops; less common for product analytics | Medium — internal analytics; some product embedding | Excellent — embedded analytics, product metric governance, BigQuery native |
| Manufacturing / Operations | Excellent — Azure IoT integration, supply chain dashboards, Teams embedding | High — process visualisation, quality control analytics | Medium — strong governance but LookML overhead for operational reporting |
| Education / Public Sector | Excellent — Microsoft 365 academic pricing, government Azure deployment | High — student outcome visualisation, public data journalism | Medium — governance is valued; cost may be prohibitive for budget-constrained institutions |
Power BI vs Tableau vs Looker: Pricing, Market Data and Team Cost Analysis
Power BI Market Share
30%
Global BI market share; 97% Fortune 500 adoption; Gartner Leader 18 consecutive years
Tableau Growth Rate
16%
Post-Salesforce integration growth rate — significantly higher than most BI vendors
Looker Reporting Speed
85%
Faster reporting cycles reported by Looker customers after implementation (TrustRadius)
Power BI ROI
58%
Of organisations see Power BI pay for itself within one year; saves 125+ hours per user annually
Full Pricing Comparison: Power BI vs Tableau vs Looker
| Tier / Licence | Power BI | Tableau | Looker |
|---|---|---|---|
| Free / Entry | Power BI Desktop (free, Windows only); Power BI Service with limited sharing | Tableau Public (free, public data only); Tableau Viewer $15/user/month | No free tier; Looker Studio (separate Google product) is free |
| Standard individual | Pro: $10/user/month — unlimited sharing, 1GB dataset, standard refresh | Explorer: $42/user/month — edit existing dashboards, connect to published data | Standard: ~$66,600/year for 10 users (~$555/user/month effective rate) |
| Power user / analyst | Premium Per User: $20/user/month — larger model sizes, advanced AI, Premium features | Creator: $70/user/month — full Tableau Desktop, data connections, dashboard building | Developer add-on: $1,665/user/year (~$139/user/month); LookML development access |
| Enterprise / capacity | Premium Per Capacity: from $5,000/month — unlimited viewers, larger models, advanced AI, Fabric | Tableau Server (self-hosted) or Tableau Cloud — custom enterprise pricing; usage-based options available | Advanced: ~$132,000/year; Elite: custom; includes additional API calls and Looker Servers |
| Viewer / read-only | Free with Premium Per Capacity licence — unlimited viewers once capacity is purchased | Viewer: $15/user/month — view only, no editing | Viewer add-on: $400/user/year (~$33/user/month) |
Team Cost Comparison (50 Users — Mixed Roles)
| Scenario | Power BI | Tableau | Looker |
|---|---|---|---|
| Annual licensing cost (50 users, mixed roles) | $6,000–$12,000 | $25,000–$40,000 | $36,000–$60,000 |
| Implementation / setup cost | Low — Microsoft ecosystem familiarity reduces consulting need | Moderate — Tableau specialist consultants; Tableau certification common | High — LookML developer required; significant initial modelling investment |
| Training cost | Low — Excel-familiar; extensive free Microsoft documentation | Moderate — Tableau Desktop certification; dedicated training investment common | High — LookML requires data engineering background; formal training required |
| Total Cost of Ownership (3-year, 50 users) | Lowest — typical range $25,000–$50,000 over 3 years all-in | High — typical range $100,000–$180,000 over 3 years all-in | Highest — $200,000–$350,000+ over 3 years (licensing + LookML developer costs) |
| Cost per insight hour (approximate) | Lowest — broad access to create and consume analytics at Pro pricing | Medium — high quality per insight but at 7× Power BI’s per-user cost | Highest — governed, high-quality insights; realised ROI requires full LookML implementation |
Hidden and Total Cost of Ownership Considerations
Beyond the Licence Price
The Power BI vs Tableau vs Looker licence price comparison understates the real cost differential. For Power BI, the practical additional costs are Microsoft Fabric or Premium capacity if Copilot AI is required ($5,000+/month — significant for smaller organisations) and Windows-only development tooling that excludes Mac-based analyst teams.
For Tableau, Creator licences at $70/month are the tip; Tableau+ for AI features, Tableau Server infrastructure for self-hosted deployments, and the ongoing cost of a specialist Tableau analytics team to maintain complex workbooks add materially to the total. For Looker, the LookML developer role — typically a data engineer earning $80,000–$120,000 annually — is effectively a required cost of running Looker at scale. No LookML developer means no new metrics, no new analyses, and no data model evolution. This makes Looker’s true total cost of ownership the highest of the three by a significant margin — justified only when the governance value (eliminating $X in analytics debt and data inconsistency costs) exceeds the LookML overhead.
Power BI vs Tableau vs Looker: Decision Framework
The Right Tool Is Determined by Your Stack, Not Your Features Wish List
The Power BI vs Tableau vs Looker decision is less about features and more about fit. All three tools are capable of producing excellent analytics. The question is which one your team will actually adopt, use consistently, and extract value from — and that is almost entirely determined by your existing technology stack, your team composition, and your primary analytics use case. A Microsoft 365 shop with 80% Excel users and a $20,000 BI budget has a different answer than a Salesforce-centric company with a dedicated BI team and high-stakes executive dashboards, which is different again from a SaaS company building analytics into its product for enterprise customers.
Choose Power BI If:
- Your organisation runs Microsoft 365, Azure, or Dynamics — Power BI’s ecosystem integration eliminates most connectivity and infrastructure complexity
- Cost is a primary factor — no other enterprise BI platform delivers comparable capability at $10/user/month, and 58% of organisations see it pay for itself within a year
- Your analysts are Excel users — the learning curve from Excel to Power BI is the shortest of the three platforms; you will see productivity faster
- You need broad BI access across 50–500 users without a dedicated BI team — Power BI’s self-service model and built-in report creation lower the analyst-to-consumer ratio
- You want AI-assisted report creation embedded in your existing Microsoft tooling — Copilot in Power BI integrates with the broader Microsoft Copilot ecosystem your team likely already uses
- Adoption scale matters more than visualisation depth — Power BI’s 30% market share means the largest talent pool, most third-party integrations, and most learning resources
Choose Tableau If:
- Visualisation quality is your primary requirement — executive presentations, client-facing dashboards, or public analytics where visual impact creates real business value
- Your organisation uses Salesforce — Tableau’s native Einstein 1 Platform integration for CRM analytics is a decisive advantage no other BI tool matches
- You have dedicated BI professionals — Tableau rewards expertise; analysts with deep Tableau skills extract value that casual users cannot, and those skills exist in a large talent market
- You are doing complex data exploration — hypothesis-driven analysis, cohort analysis, and multi-dimensional exploration through calculated fields and table calculations that would require code in other tools
- You want Tableau Pulse’s proactive alert model — pushing metric changes to users rather than waiting for them to open dashboards represents a meaningful UX advance for executive users
- Your budget is adequate — $25,000–$40,000 per year for 50 users is the entry point; justify this by identifying specific business outcomes that require Tableau’s visualisation depth or Salesforce integration
Choose Looker If:
- Data governance and metric consistency are your critical requirements — “which revenue number is right?” is a recurring problem in your organisation that has real business cost
- You are building embedded analytics into a SaaS product — Looker’s API-first architecture, multi-tenancy, and SDK are specifically designed for productised analytics
- You use Google Cloud and BigQuery as your primary data platform — Looker’s native BigQuery integration, Vertex AI connection, and Gemini AI provide the tightest Google-native analytics stack
- You can staff a LookML developer — this is a hard requirement, not a nice-to-have; Looker without LookML expertise delivers a fraction of its potential value
- You operate in a regulated industry requiring auditable data access — Looker’s governance framework, audit trails, and access controls meet compliance requirements that Power BI and Tableau cannot match without significant additional tooling
- ROI calculation supports it — Looker’s 85% faster reporting cycles and metric governance eliminate measurable analytics debt; calculate what inconsistent metrics and data engineering overhead costs your organisation before comparing to Looker’s licence premium
Power BI vs Tableau vs Looker: Quick Decision Table
| Situation | Best Choice | Key Reason |
|---|---|---|
| 100% Microsoft 365 / Azure org | Power BI | Ecosystem integration; near-zero marginal cost if already licensed |
| Salesforce CRM is your primary data | Tableau | Native Einstein 1 Platform integration; CRM-specific AI insights |
| Building analytics into a SaaS product | Looker | API-first, embedded SDK, multi-tenancy designed for productised analytics |
| Budget under $15,000/year for 50 users | Power BI | Only enterprise BI option viable at this price point |
| Executive board presentations with high design standards | Tableau | Visualisation quality and flexibility unmatched in the BI market |
| Google Cloud / BigQuery primary platform | Looker | Native integration; optimised SQL generation; Gemini AI |
| Metric disagreement across teams (“which revenue is right?”) | Looker | LookML semantic layer enforces single source of truth by design |
| Analyst team with Excel background | Power BI | Shortest learning curve; DAX is Excel-familiar |
| Complex multi-source exploratory analysis | Tableau | Calculated fields, parameters, and visual flexibility reward expert users |
| Financial services / regulated industry | Looker or Tableau | Looker for governance; Tableau for complex regulatory reporting visuals |
Frequently Asked Questions
The fundamental difference between Power BI vs Tableau vs Looker reflects three distinct philosophies about what business intelligence is for. Power BI (Microsoft) is an accessible, affordable BI platform optimised for organisations in the Microsoft 365 ecosystem — its goal is to democratise analytics for every employee at the lowest possible cost, leveraging Excel familiarity and Teams/SharePoint integration.
Tableau (Salesforce) is a visual analytics platform optimised for data analysts and BI professionals who need the best data visualisation and exploration capability on the market — its goal is depth of insight through superior visual design and interaction. Looker (Google Cloud) is a data governance and semantic modelling platform that uses LookML to define all business logic in one auditable place — its goal is organisational metric consistency, not visualisation. In practice: Power BI wins on value, Tableau wins on visualisation, and Looker wins on governance.
Power BI is the most widely adopted BI platform globally. It holds approximately 30% of the global BI market and 22.45% of the analytics platform market per 2026 data. 97% of Fortune 500 companies rely on it.
Tableau holds approximately 17.75% of the analytics market — second place. Together, Power BI and Tableau account for approximately 40% of all BI platform usage globally. Looker occupies a premium niche rather than broad market position — its user base is smaller but its satisfaction scores are higher (4.5/5 Gartner rating vs 4.4/5 for both Power BI and Tableau). Gartner’s 2025 Magic Quadrant places Microsoft as the leader for the 18th consecutive year, with Tableau as the 12th-consecutive-year leader, and Looker having joined the Leaders quadrant in 2024. In terms of career demand, Power BI skills are the most sought-after BI competency in job listings globally, followed by Tableau, with Looker/LookML as a specialist premium skill.
Yes — Power BI is significantly cheaper than Tableau at every tier, and Looker is more expensive than both. Power BI Pro costs $10/user/month; Tableau Creator (the equivalent analyst licence) costs $70/user/month — a 7× difference. For a 50-user team with mixed roles, annual licensing costs approximately $6,000–$12,000 for Power BI, $25,000–$40,000 for Tableau, and $36,000–$60,000 for Looker.
The 3-year total cost of ownership (including training, implementation, and maintenance) is estimated at $25,000–$50,000 for Power BI vs $100,000–$180,000 for Tableau vs $200,000–$350,000+ for Looker at similar team sizes. The important caveat: organisations already paying for Microsoft 365 often find that Power BI Pro is included at zero marginal cost in E3/E5 licensing. The Looker premium is justified by the LookML governance value — but requires a dedicated LookML developer ($80,000–$120,000 annual salary) to realise that value, which is a real additional cost not reflected in the licence price comparison.
LookML is Looker’s proprietary data modelling language — a code-based layer that sits between your data warehouse and your analytics users, defining all business logic, metric calculations, data relationships, and access permissions in a single, version-controlled, auditable location. When a Looker data team writes a LookML definition of “revenue” — specifying which table, which rows, which calculation method, which access rules — that definition applies to every report, dashboard, data export, and API call across the entire organisation.
No analyst can create a report with a different revenue calculation, because the LookML model does not allow it. This “single source of truth” is Looker’s fundamental differentiator from Power BI and Tableau. In Power BI, 20 analysts can create 20 different revenue calculations in 20 different dashboards — all technically valid, all potentially different. The same is true in Tableau. LookML makes metric inconsistency architecturally impossible rather than just organisationally discouraged. The trade-off is flexibility: LookML requires specialist engineering expertise to write and maintain, and business analysts cannot create new analyses outside the defined model without data team support. This is why Looker is a data engineering platform as much as a BI tool, and why it commands enterprise pricing that reflects data infrastructure value rather than just analytics user licences.
Looker and Looker Studio are two completely different products despite sharing the Looker name. Looker is an enterprise BI and data governance platform acquired by Google in 2019 for $2.6 billion — it uses the LookML semantic modelling language, requires enterprise licensing starting at approximately $66,600/year, and is designed for data engineering teams and organisations requiring governed analytics at scale.
Looker Studio (formerly Google Data Studio) is a free, web-based data visualisation tool available to anyone with a Google account — it provides drag-and-drop dashboard creation, integrates with Google products (Analytics, Sheets, BigQuery, Ads), and supports 1,270+ data connectors via community connectors. Looker Studio is functionally comparable to a free version of Power BI Desktop or a very lightweight Tableau Public, not to enterprise Looker. When articles or job descriptions mention “Looker” in an enterprise analytics context, they mean the enterprise platform with LookML. “Looker Studio” is a separate consumer-grade tool aimed at marketers and small businesses who need quick, free reports from Google data sources.
For most beginners, Power BI is the recommended first BI tool to learn in 2026, for three practical reasons. First, the learning curve: Power BI’s DAX formula language is Excel-familiar, and most analysts have Excel experience — the transition is significantly smoother than learning Tableau’s calculated fields or Looker’s LookML from scratch. Second, job market demand: Power BI skills appear in more job listings than any other BI tool, making Power BI the highest-ROI investment for career development.
Third, cost: Power BI Desktop is free to download and use for personal projects, enabling practice without any subscription. That said, Tableau is the right second tool to learn — its drag-and-drop exploration model and visualisation depth make it the preferred tool at many data-forward organisations and analytics agencies, and the Tableau Public portfolio is widely respected by hiring managers. LookML/Looker should be treated as an advanced specialisation rather than a starting point — it requires SQL proficiency, data modelling knowledge, and an understanding of data warehouse architecture before it becomes accessible. Beginners who know they are targeting a specific Looker-heavy organisation should learn SQL first, Power BI or Tableau second, and then LookML as a specialisation.
All three platforms launched significant AI capabilities in 2025–2026, but they approach AI differently and gate features at different pricing tiers. Power BI Copilot generates complete reports from plain English descriptions, writes DAX queries from natural language, and creates narrative summaries — deeply integrated with Microsoft’s broader Azure OpenAI and Microsoft 365 Copilot ecosystem, but requires Fabric F64 or Premium P1 capacity to access.
Tableau Agent (formerly Einstein Copilot) enables natural language queries and automated data preparation, while the distinctively valuable Tableau Pulse sends proactive metric alerts to users without them needing to open dashboards — but both require a Tableau+ subscription above standard Creator/Explorer/Viewer pricing. Looker’s Gemini-powered AI is unique because it operates within the LookML semantic layer — natural language queries cannot bypass metric definitions or access data that the LookML model restricts, making Looker’s AI the only governance-native analytics AI of the three. For organisations that have invested in LookML governance, this is a significant safety advantage: Copilot and Tableau Agent can potentially surface data or calculations inconsistent with intended metric definitions, while Gemini in Looker cannot violate the governance model by design. The practical advice: all AI features require premium tier investment in all three platforms — budget for this separately from base licences when evaluating TCO.
Yes — many large organisations use multiple BI tools simultaneously for different use cases, though this introduces governance complexity and can dilute ROI on each tool. Common multi-tool configurations include: Power BI for broad enterprise reporting and operational dashboards (used by non-technical business users), plus Tableau for the analytics team’s complex visual work and client-facing dashboards — a configuration that optimises cost for scale (Power BI) while maintaining visual quality for high-stakes use cases (Tableau).
Alternatively, Looker as the governed semantic layer providing the single source of truth, with Power BI or Tableau consuming Looker’s API-defined metrics for visualisation — using Looker’s governance strengths while supplementing with the visualisation depth of Tableau or the ecosystem integration of Power BI. Running all three simultaneously is rare and creates metric consistency challenges across tools. If Looker is chosen as the semantic layer, its governance advantage is most realised when all analytics consumers are constrained by the LookML model — allowing Power BI users to create their own DAX calculations alongside LookML-defined metrics partially defeats Looker’s purpose.
Gartner’s Magic Quadrant for Analytics and Business Intelligence Platforms is an annual analyst research report that positions vendors in a 2×2 matrix based on their Completeness of Vision (horizontal axis) and Ability to Execute (vertical axis). The four quadrants are Leaders (upper right — strong vision and execution), Challengers (upper left — strong execution, weaker vision), Visionaries (lower right — strong vision, weaker execution), and Niche Players (lower left).
In the 2025 Magic Quadrant (the most recent complete report available in 2026), Microsoft Power BI is positioned furthest on Completeness of Vision and highest in Ability to Execute — the top-right corner — maintaining its position as the market-dominant Leader for the 18th consecutive year. Salesforce (Tableau) is a Leader for the 12th consecutive year, positioned close to Microsoft in the upper-right quadrant. Google (Looker) entered the Leaders quadrant in the 2024 Gartner report, reflecting its strategic position following the integration of Looker with Google Cloud’s AI and data services. Gartner’s ratings from verified users: Power BI 4.4/5 from 3,979 reviews; Tableau 4.4/5 from 3,979 reviews; Looker 4.5/5 from 908 reviews — Looker achieves the highest per-user satisfaction despite its smaller footprint.
The Power BI vs Tableau vs Looker landscape beyond 2026 is being shaped by three structural forces. First, AI-driven analytics: all three platforms are investing heavily in natural language query, automated insight generation, and proactive alerting — the distinction between a “BI tool” and an “AI analytics assistant” is blurring. By 2027–2028, the question may not be “which dashboard shows what?” but “which AI gave me the right answer?” Second, cloud data warehouse consolidation: as Snowflake, BigQuery, and Databricks become the universal data layer, the BI tool’s job increasingly shifts from data management to query and presentation — reducing Power BI’s data management advantage and potentially strengthening Looker’s warehouse-push model.
Third, the semantic layer becoming a separate category: tools like dbt (data build tool), AtScale, and Cube are emerging as standalone semantic layers that work with any BI tool — potentially commoditising what makes Looker distinctive and allowing organisations to get LookML-like governance with Power BI or Tableau visualisation on top. The Tableau Next announcement (2025) signals Salesforce’s intent to substantially redesign Tableau’s architecture for the AI era. Microsoft Fabric’s expansion continues to embed Power BI more deeply into the data engineering stack. Looker’s future depends on Google’s continued investment in its enterprise data platform — Google’s track record with enterprise product commitment has been mixed, which some large enterprises cite as a Looker adoption risk.
Power BI vs Tableau vs Looker: Final Takeaways for 2026
The Power BI vs Tableau vs Looker comparison reaches a clear, practical conclusion: these are not three versions of the same tool — they are three different answers to three different questions about what analytics infrastructure should prioritise.
Power BI — Key Takeaways:
- 30% global BI market; 97% Fortune 500; 22.45% analytics market
- Gartner Leader 18 consecutive years; highest in Ability to Execute
- $10/user/month Pro; 50-user team $6K–$12K/year
- Best value — 80% enterprise BI at 20% of Tableau’s cost
- Microsoft 365 ecosystem integration is decisive advantage
- Power BI Copilot AI requires Fabric/Premium tier
Tableau — Key Takeaways:
- ~17.75% analytics market; Gartner Leader 12 consecutive years
- 16% growth post-Salesforce integration — strongest growth of the three
- $70/user/month Creator; 50-user team $25K–$40K/year
- Best visualisation — 100+ chart types, unmatched design flexibility
- Salesforce CRM integration unique advantage; Tableau Pulse proactive insights
- Tableau Agent AI requires Tableau+ premium on top of standard licensing
Looker — Key Takeaways:
- Gartner Leader (joined 2024); 4.5/5 from 908 reviews — highest satisfaction
- ~$66,600/year for 10 users; 50-user team $36K–$60K/year
- Best governance — LookML semantic layer is single source of truth
- 85% faster reporting cycles reported by customers (TrustRadius)
- API-first; best embedded analytics for SaaS product builders
- Requires LookML developer; highest total cost of ownership
Practical Recommendation for 2026:
Start with Power BI if you are in a Microsoft 365 organisation, have a constrained BI budget, or are deploying BI broadly across a non-specialist user base. The $10/month Pro tier delivers exceptional value, and the Microsoft ecosystem integration eliminates most connectivity and infrastructure overhead. 58% of organisations see it pay for itself in under a year — the lowest-risk BI investment available.
Invest in Tableau if visualisation quality drives real business outcomes for your organisation — executive buy-in, client relationships, or public-facing analytics — or if you are a Salesforce customer where the native CRM integration creates analytics capabilities Power BI cannot match. Budget appropriately: $70/month Creator licences plus Tableau+ for AI features make Tableau a considered investment, not an afterthought.
Choose Looker if metric inconsistency is costing your organisation more than the LookML investment would cost to solve — or if you are a SaaS company building analytics into your product. Looker’s value is realised through the governance premium, not the dashboard quality. If you cannot staff a LookML developer, Looker will underdeliver relative to its cost.
Related Topics Worth Exploring
Apache Spark vs Apache Kafka
Power BI, Tableau, and Looker sit at the consumption layer of the data stack. Apache Spark and Kafka power the processing and streaming layers that prepare data for these tools — understanding when to use each, and how they feed the data warehouses that Power BI vs Tableau vs Looker query, gives you the complete data analytics architecture picture.
Data Lake vs Data Warehouse vs Lakehouse
The architectural choice between data lake, data warehouse, and lakehouse directly determines which BI tool performs best on your data. Looker is optimised for cloud data warehouses (BigQuery, Snowflake); Power BI connects best to Azure data services; Tableau provides the most flexible cross-source connectivity. Understanding the storage layer informs the BI tool decision.
MLOps vs DevOps
All three BI platforms are adding AI and ML features — Copilot, Tableau Agent, Gemini. The MLOps layer that trains, deploys, and monitors those AI analytics models is a separate but adjacent discipline. Understanding how MLOps integrates with enterprise BI platforms gives data teams the complete picture of AI-augmented analytics infrastructure in 2026.