Raster scan vs random scan is about where the beam goes and what gets stored. A raster scan display sweeps every scan line, top to bottom. It stores an intensity value for every pixel in a frame buffer. Instead, a random scan display works differently. It sends the beam only to the parts of the screen where a line exists. It stores those line commands in a display list instead. Because raster scan touches every pixel, it can shade and fill areas. A diagonal line, though, shows a jagged staircase. Because random scan draws only its lines, those lines stay smooth. But the display cannot fill or shade areas well. Raster refresh runs at a fixed rate, typically 60 to 80 Hz. In fact, that rate does not depend on picture complexity. Random scan refresh time grows with the line count instead. So a busy picture can flicker. Nearly every screen in use today is therefore a raster scan display.
Every picture on a screen starts as an electron beam in motion. How that beam is steered defines two very different display families. One sweeps the whole screen in fixed lines. The other steers the beam only where a picture actually needs it. So that single choice shapes memory needs, image quality, and refresh behaviour.
GATE and university papers ask this topic often, since it tests a core distinction cleanly. Examiners like frame buffer size questions, in KB or MB, at a given resolution and colour depth. They also ask which display type suits filled graphics over line drawings. This guide covers both display types in full. It then works through a frame buffer calculation, step by step. So check your own numbers against it as you read.
In fact, raster and random scan are not the whole pipeline. They decide how a finished picture actually reaches the screen. A raster display still has to draw lines. It does that pixel by pixel, with algorithms covered in DDA vs Bresenham line drawing algorithm. A clipped line, as in Cohen-Sutherland vs Liang-Barsky, still needs this display step to finally appear.
How a Display Actually Draws a Picture
A CRT screen is coated with phosphor dots. They glow briefly when an electron beam strikes them. The beam itself stays invisible; only the glow it leaves behind shows up.
Steering that single beam fast enough to look like a still picture is the real engineering problem. Two very different steering strategies solve it.
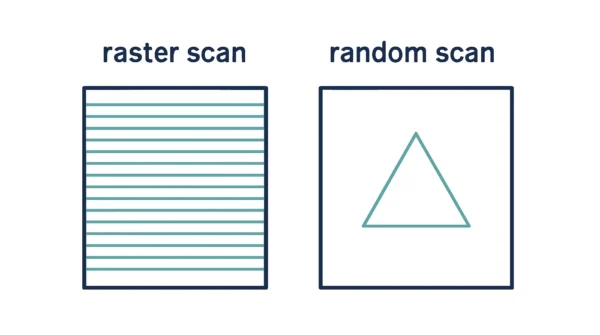
One strategy ignores the picture and scans the whole screen in a fixed pattern, line by line. Whatever the picture needs gets set pixel by pixel as the beam passes each position. This is raster scan.
The other strategy studies the picture before moving at all. It then steers the beam only along the lines the picture actually contains, skipping empty space entirely. This is random scan.
Still, both strategies existed side by side for decades. Raster scan eventually won out for general use, since television broadcast already used the same line-by-line pattern. Memory later got cheap enough to hold a full frame buffer too.
The Raster Scan Display
A raster scan display moves its beam one horizontal scan line at a time, top to bottom. It visits every pixel position on every line, whether or not anything is drawn there.
The picture itself lives in a frame buffer, also called a refresh buffer. So every screen point has its own stored intensity value there. The beam simply reads that buffer, pixel by pixel, as it sweeps.
Two kinds of retrace keep the sweep moving. Horizontal retrace happens at the end of each line, when the beam jumps back to the left edge. Vertical retrace happens once, after the last line, when the beam returns to the top-left corner. Our guide to horizontal retrace vs vertical retrace covers this timing in more depth.
Refresh happens at a fixed rate, typically 60 to 80 frames per second. That rate stays constant, no matter how complex the picture is. The beam still sweeps the same fixed grid every time.
Advantages of raster scan.
- Every pixel carries its own intensity value, so filled areas, shading, and photographic images all render cleanly.
- Refresh rate stays fixed, so a busy scene never slows the display down.
- It draws straight lines too, by lighting up the right pixels with algorithms like DDA and Bresenham.
Disadvantages of raster scan.
- A pixel grid cannot represent a true diagonal, so lines show a jagged staircase.
- Memory cost is fixed by resolution and colour depth, whether or not the picture uses the whole screen.
- Filling and shading still need a separate algorithm; see flood fill vs boundary fill algorithm for how that works.
The Random Scan Display
A random scan display steers its beam only to where the picture actually is. It traces each line segment directly, in whatever order the picture list gives it, and skips every empty region.
Engineers also call it a vector display, a stroke-writing display, or a calligraphic display. All three names point at the same beam behaviour: drawing strokes, not scanning a grid.
The picture is stored as a set of line-drawing commands, called a display list, or a refresh display file. Redrawing the picture just means replaying that list of commands again.
Refresh time depends directly on how many lines the picture contains. So a simple picture redraws quickly. A picture with hundreds of lines, though, takes longer to finish one full pass. So it can flicker if the beam falls behind.
Advantages of random scan.
- Lines come out smooth and jagged-free, since each one is traced directly rather than approximated on a grid.
- A simple picture needs very little memory, since the display list only stores what the picture actually draws.
- It suits precise line drawings, which made it the standard choice for early CAD and engineering displays.
Disadvantages of random scan.
- It cannot easily produce shaded or filled areas, or realistic photographic images.
- A complex picture, with many lines, can flicker as refresh time grows.
- It is now largely obsolete for mainstream displays, replaced almost everywhere by raster scan.
Raster Scan vs Random Scan: Comparison Table
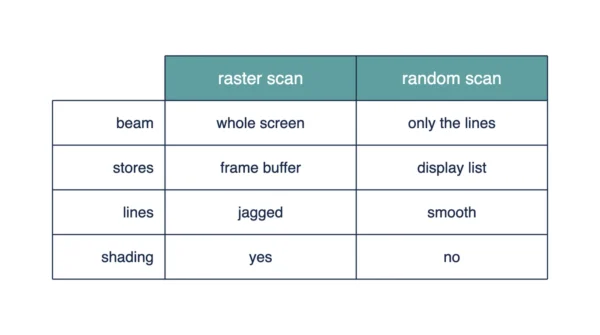
| Aspect | Raster Scan | Random Scan |
|---|---|---|
| How the beam moves | Sweeps every line, top to bottom | Moves only along drawn lines |
| What is stored | Intensity value for every pixel | A set of line-drawing commands |
| Storage name | Frame buffer, also called a refresh buffer | Display list, also called a refresh display file |
| Picture definition | Defined pixel by pixel | Defined by line endpoints |
| Line quality | Jagged, a staircase effect on diagonals | Smooth, traced directly |
| Filled areas and shading | Renders cleanly, since every pixel holds an intensity | Cannot easily fill or shade a region |
| Refresh rate behaviour | Fixed, typically 60 to 80 Hz | Varies with the picture |
| Effect of picture complexity | None; the same fixed sweep runs every time | Redraw takes longer as line count grows |
| Flicker | Not linked to picture content | Can flicker on a complex picture |
| Memory needed | Fixed by resolution and colour depth | Grows only with the number of lines |
| Resolution factor | Higher resolution needs more frame buffer memory | Resolution barely affects display list size |
| Retrace behaviour | Horizontal retrace per line, vertical retrace per frame | No fixed retrace pattern; the beam jumps between lines |
| Colour capability | Full colour, set per pixel | Limited, usually monochrome or a few colours |
| Cost and availability | Cheap, standard in nearly all modern screens | Expensive, specialised, largely historical now |
| Typical applications | TVs, monitors, phones, general-purpose graphics | Early CAD, engineering, oscilloscope-style drawings |
Worked Example: Sizing the Frame Buffer
A frame buffer holds one intensity value per pixel. So its size follows directly from three numbers: width, height, and bits per pixel.
Frame buffer size = width × height × bits per pixel.
Throughout this example, 1 KB means 1024 bytes, and 1 MB means 1024 KB. GATE answers can differ if you use 1000 instead, so always state which convention you are using.
| Resolution | Bits per pixel | Pixels | Frame buffer | At 60 Hz |
|---|---|---|---|---|
| 640 × 480 | 8 | 307,200 | 307,200 bytes = 300 KB | 17.6 MB/s |
| 1024 × 768 | 24 | 786,432 | 2,359,296 bytes = 2,304 KB = 2.25 MB | 135.0 MB/s |
| 1920 × 1080 | 24 | 2,073,600 | 6,220,800 bytes = 6,075 KB = 5.93 MB | 356.0 MB/s |
Take the 1024 × 768 row step by step. Multiply width by height: 1024 × 768 = 786,432 pixels. At 24 bits each, that is 18,874,368 bits.
Divide by 8 to convert to bytes: 2,359,296 bytes. That equals 2,304 KB, or 2.25 MB.
Refreshing that frame 60 times a second moves roughly 135 MB of data every second. So that is the real cost of keeping the picture on screen.
Now compare that against a random scan display. A picture made of a few hundred lines needs only a tiny display list. That holds, no matter how big the screen is. A raster display, instead, pays for every pixel, whether the picture uses it or not. That is the whole memory trade-off in one sentence.
Why Raster Lines Look Jagged and Vector Lines Do Not
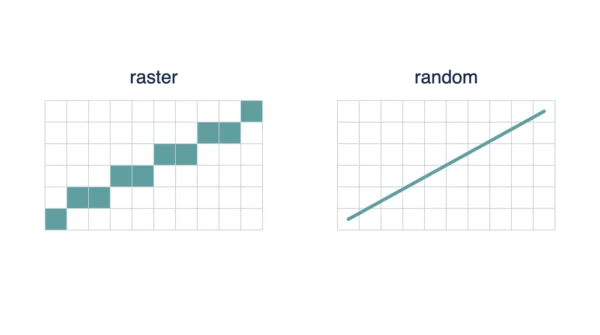
A raster display can only light up whole pixels, arranged on a fixed grid. A perfectly diagonal line rarely lines up with that grid.
So the display approximates the diagonal with a run of small horizontal and vertical steps instead. Seen up close, that run looks like a staircase. This effect is called aliasing.
Higher resolution helps, since the steps get smaller and less noticeable. Even so, a raster display at any resolution can still show some staircase effect on a steep enough diagonal. Still, resolution only reduces aliasing; it does not remove it.
A random scan display avoids this problem, since it never approximates a line with pixels. The beam simply traces the line’s true path, so the result stays smooth regardless of the angle.
That contrast is why CAD tools once favoured vector displays for technical drawings. A clean diagonal line actually matters there.
Where Each One Is Used
Raster scan runs almost every screen in everyday use now: phones, laptops, televisions, and projector displays in exam halls. Photographs, video, and shaded 3D scenes all need the per-pixel intensity that only a frame buffer can hold.
Random scan mattered most in an earlier era of CAD systems, engineering workstations, and oscilloscope-style displays. Those drawings were mostly outlines. So a picture of a few hundred clean lines suited its display list well.
Today, random scan hardware is largely historical. Modern CAD software still draws smooth-looking lines. It does so with anti-aliasing on ordinary raster hardware, though, not with a dedicated vector beam.
Once a scene is ready for the screen, it still has to be positioned correctly. See viewport vs window in computer graphics for how that mapping step works before any pixel gets lit.
Interview Questions
Frequently Asked Questions
Wrapping Up
Raster scan and random scan solve the same problem, getting a picture onto a screen, in almost opposite ways. Raster scan sweeps every pixel and pays a fixed memory cost for it. Random scan traces only the lines a picture needs, and pays that cost in refresh time instead.
Remember the essentials for your exam. Frame buffer size is width times height times bits per pixel, and the KB versus MB convention matters. Random scan refresh time depends on line count; raster refresh does not. Raster can fill and shade; random scan mostly cannot, though its lines stay smoother.
Related reading on DiffStudy:
- Horizontal Retrace vs Vertical Retrace in Computer Graphics
- DDA vs Bresenham Line Drawing Algorithm
- Cohen-Sutherland vs Liang-Barsky Line Clipping
- Flood Fill vs Boundary Fill Algorithm
- CS Fundamentals hub